Immunofluorescence database
Database 1 - Examples of
NeuN staining for rat and macaque frontal cortex using Protocols A and
B
To view database 1, first download the following free program Zeiss LSM Image Browser (this is a Windows based program for PC users). Next, left-click Database 1, which will call up a file download window. Save the compressed database to a local folder on your computer and decompress using WinZip Self-Extractor, StuffIt Expander or other standard software. The folder will then contain a database file (.mdb) and its associated individual .lsm image files. Access the database using Zeiss LSM Image Browser. Detailed information about the confocal microscope settings used for each scan is included (info).
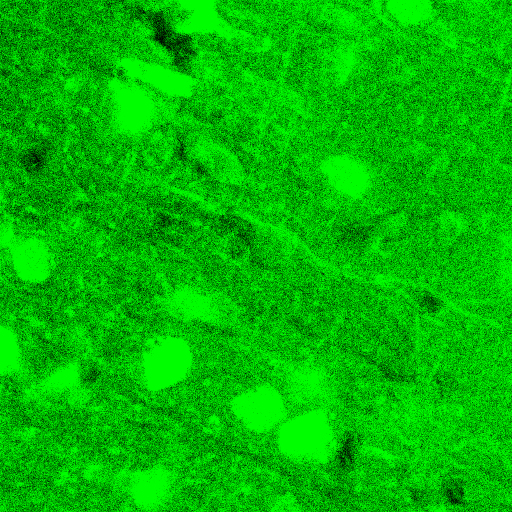
Protocol A produces NeuN
staining with a higher signal to noise ratio and better overall quality
than protocol B. Examples of images of NeuN staining taken from rat
tissue used in this analysis are below. Additional examples of
macaque tissue processed similarly are also provided. Qualitative
assessment of the confocal scans from the macaque brains and viewing
the tissue directly under a conventional fluorescent microscope reveal
a similar relationship to that which was observed for the rat
tissue.
| Protocol
A |
Protocol B |
Notes |
|

|
|
Rat 1 NeuN staining in
anterior neocortex. These images were obtained by scanning with the
settings which brought the maximal intensity of the most brightly
labeled cells for either protocol near, but not to, the maximal
intensity of 255 greyscale. The settings were held constant throughout
the analysis. Some evidence of non-specific labeling is observed in
tissue stained using Protocol B when scanned at these settings. |
|

|
 |
Rat 1 NeuN staining in
anterior neocortex. These images were obtained by scanning with
settings optimized for tissue stained using Protocol B. |
 |
 |
Macaque 1 NeuN staining in
the prefrontal cortex. These images were obtained by scanning using the
settings optimized for tissue processed with Protocol A. |
 |
 |
Macaque 1 NeuN staining in the
prefrontal cortex. These images were obtained by scanning using the
settings optimized for tissue processed with Protocol B.
Using both sets of scanning
parameters, Protocol A produced brighter NeuN staiing relative to the
background. |
|